使用 OTEL SDK - Python
在本教程中,我们将向您展示如何使用 OpenTelemetry 为 Python Flask 应用程序进��行仪器化,并将跟踪数据发送到 Quickwit。本教程受到 Python OpenTelemetry 文档的启发,感谢 OpenTelemetry 团队!
前提条件
- 已安装 Python3
- 已安装 Docker
启动一个 Quickwit 实例
安装 Quickwit 并启动一个 Quickwit 实例:
./quickwit run
启动 Jaeger UI
让我们使用 Docker 启动一个 Jaeger UI 实例。在这里我们需要告知 Jaeger 使用 Quickwit 作为其后端。
由于容器网络的一些特殊性,我们将在 MacOS 和 Windows 以及 Linux 上采用不同的方法。
MacOS 和 Windows
我们可以依赖 host.docker.internal 获取指向我们 Quickwit 服务器的 Docker 桥接 IP 地址。
docker run --rm --name jaeger-qw \
    -e SPAN_STORAGE_TYPE=grpc-plugin \
    -e GRPC_STORAGE_SERVER=host.docker.internal:7281 \
    -p 16686:16686 \
    jaegertracing/jaeger-query:latest
Linux
默认情况下,Quickwit 监听的是 127.0.0.1,并且不会响应指向 Docker 桥接 (172.17.0.1) 的请求。有多种方法可以解决这个问题。
最简单的方法可能是使用主机网络模式。
docker run --rm --name jaeger-qw --network=host \
    -e SPAN_STORAGE_TYPE=grpc-plugin \
    -e GRPC_STORAGE_SERVER=127.0.0.1:7281 \
    -p 16686:16686 \
    jaegertracing/jaeger-query:latest
运行一个简单的 Flask 应用
我们将启动一个 Flask 应用程序,该程序在每个 HTTP 调用 http://localhost:5000/process-ip 上执行三件事:
- 从 https://httpbin.org/ip 获取 IP 地址。
- 解析它,并使用随机休眠进行伪造处理。
- 以随机休眠时间显示它。
我们首先安装依赖项:
pip install flask
pip install opentelemetry-distro
pip install opentelemetry-exporter-otlp
opentelemetry-distro 包会安装 API、SDK 以及您将使用的 opentelemetry-bootstrap 和 opentelemetry-instrument 工具。
以下是我们的应用代码:
import random
import time
import requests

from flask import Flask

app = Flask(__name__)

@app.route("/process-ip")
def process_ip():
    body = fetch()
    ip = parse(body)
    display(ip)
    return ip

def fetch():
    resp = requests.get('https://httpbin.org/ip')
    body = resp.json()
    return body

def parse(body):
    # Sleep for a random amount of time to make the span more visible.
    secs = random.randint(1, 100) / 1000
    time.sleep(secs)

    return body["origin"]

def display(ip):
    # Sleep for a random amount of time to make the span more visible.
    secs = random.randint(1, 100) / 1000
    time.sleep(secs)

    message = f"Your IP address is `{ip}`."
    print(message)

if __name__ == "__main__":
    app.run(port=5000)
Auto-instrumentation
OpenTelemetry 提供了一个名为 opentelemetry-bootstrap 的工具,它可以自动为您仪器化 Python 应用程序。
opentelemetry-bootstrap -a install
现在一切就��绪,我们可以运行应用了:
# We don't need metrics.
OTEL_METRICS_EXPORTER=none \
OTEL_TRACES_EXPORTER=console \
OTEL_SERVICE_NAME=my_app \
python my_app.py
通过访问 http://localhost:5000/process-ip,您应该能在控制台看到相应的跟踪记录。
这已经很好了,但如果我们可以记录每个步骤所花费的时间、获取 HTTP 请求的状态码以及响应的内容类型,那就更好了。让我们通过手动仪器化我们的应用来实现这一点!
手动 instrumentation
import random
import time
import requests

from flask import Flask

from opentelemetry import trace

# Creates a tracer from the global tracer provider
tracer = trace.get_tracer(__name__)

app = Flask(__name__)

@app.route("/process-ip")
@tracer.start_as_current_span("process_ip")
def process_ip():
    body = fetch()
    ip = parse(body)
    display(ip)
    return ip

@tracer.start_as_current_span("fetch")
def fetch():
    resp = requests.get('https://httpbin.org/ip')
    body = resp.json()

    headers = resp.headers
    current_span = trace.get_current_span()
    current_span.set_attribute("status_code", resp.status_code)
    current_span.set_attribute("content_type", headers["Content-Type"])
    current_span.set_attribute("content_length", headers["Content-Length"])

    return body

@tracer.start_as_current_span("parse")
def parse(body):
    # Sleep for a random amount of time to make the span more visible.
    secs = random.randint(1, 100) / 1000
    time.sleep(secs)

    return body["origin"]

@tracer.start_as_current_span("display")
def display(ip):
    # Sleep for a random amount of time to make the span more visible.
    secs = random.randint(1, 100) / 1000
    time.sleep(secs)

    message = f"Your IP address is `{ip}`."
    print(message)

    current_span = trace.get_current_span()
    current_span.add_event(message)

if __name__ == "__main__":
    app.run(port=5000)
我们现在可以启动新的仪器化应用:
OTEL_METRICS_EXPORTER=none \
OTEL_TRACES_EXPORTER=console \
OTEL_SERVICE_NAME=my_app \
opentelemetry-instrument python my_instrumented_app.py
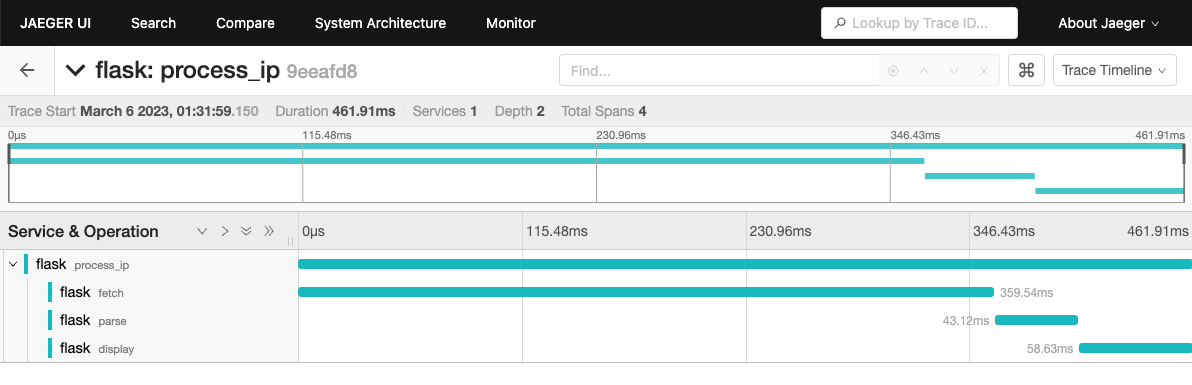
如果您再次访问 http://localhost:5000/process-ip,您应该能看到带有名称 fetch、parse 和 display 的新跨度以及相应的自定义属性!
将跟踪数据发送到 Quickwit
要将跟踪数据发送到 Quickwit,我们需要使用 OTLP 导出器。这非常简单:
OTEL_METRICS_EXPORTER=none \ # We don't need metrics
OTEL_SERVICE_NAME=my_app \
OTEL_EXPORTER_OTLP_TRACES_ENDPOINT=http://localhost:7281 \
opentelemetry-instrument python my_instrumented_app.py
现在,如果您访问 http://localhost:5000/process-ip,跟踪数据将被发送到 Quickwit,只需等待大约 30 秒即可完成索引。是时候休息一下喝杯咖啡了!
30 秒过去了,让我们查询服务的跟踪数据:
curl -XPOST http://localhost:7280/api/v1/otel-trace-v0/search -H 'Content-Type: application/json' -d '{
    "query": "resource_attributes.service.name:my_app"
}'
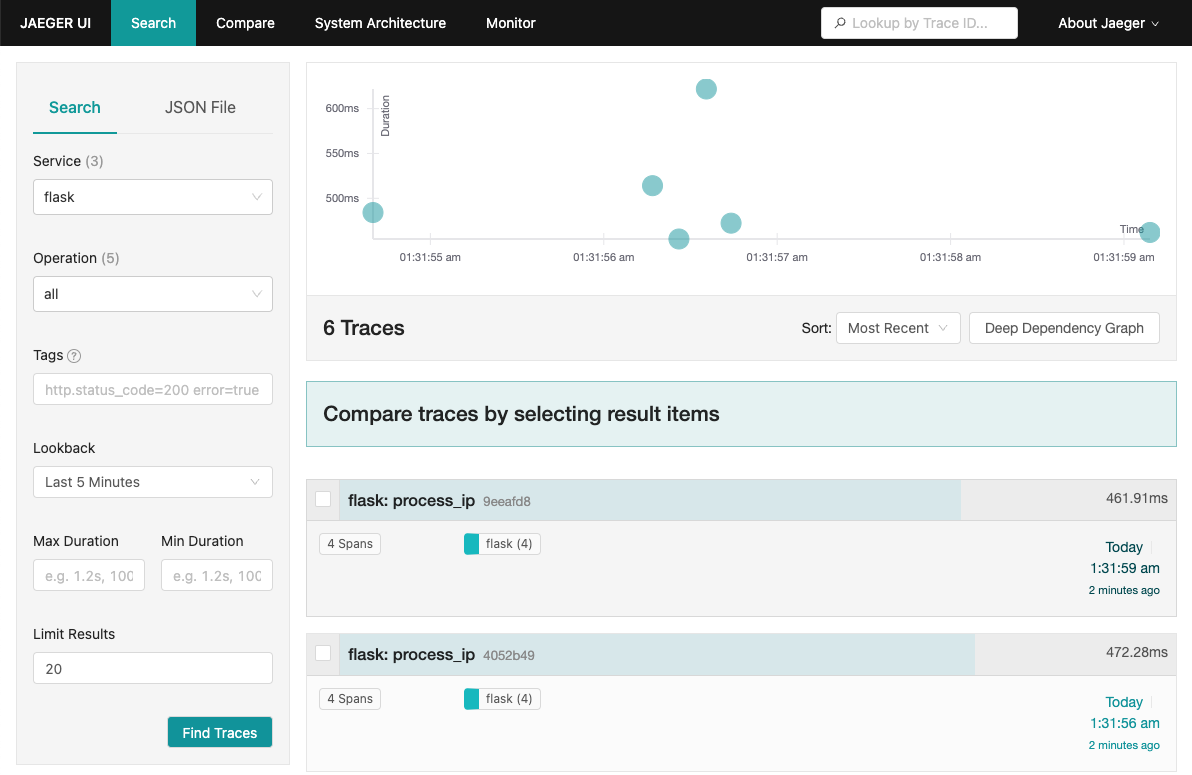
然后打开 Jaeger UI localhost:16686 并进行操作,现在您有了一个由 Quickwit 存储后端支持的 Jaeger UI!
将跟踪数据发送到您的 OpenTelemetry 收集器
按照 OpenTelemetry 收集器教程 中的说明启动一个收集器,并执行以下命令:
OTEL_METRICS_EXPORTER=none \ # We don't need metrics
OTEL_SERVICE_NAME=my_app \
opentelemetry-instrument python instrumented_app.py
跟踪数据将被发送到您的收集器,然后再发送到 Quickwit。
总结
在本教程中,我们学习了如何使用 OpenTelemetry 为 Python 应用程序进行仪器化,并将跟踪数据发送到 Quickwit。同时,我们也了解了如何使用 Jaeger UI 分析这些跟踪数据。
所有的代码片段都可在我们的 教程仓库 中找到。